Category: NHL

  • Vegas Golden Knights 2018-19 Forecast Through 62 Games

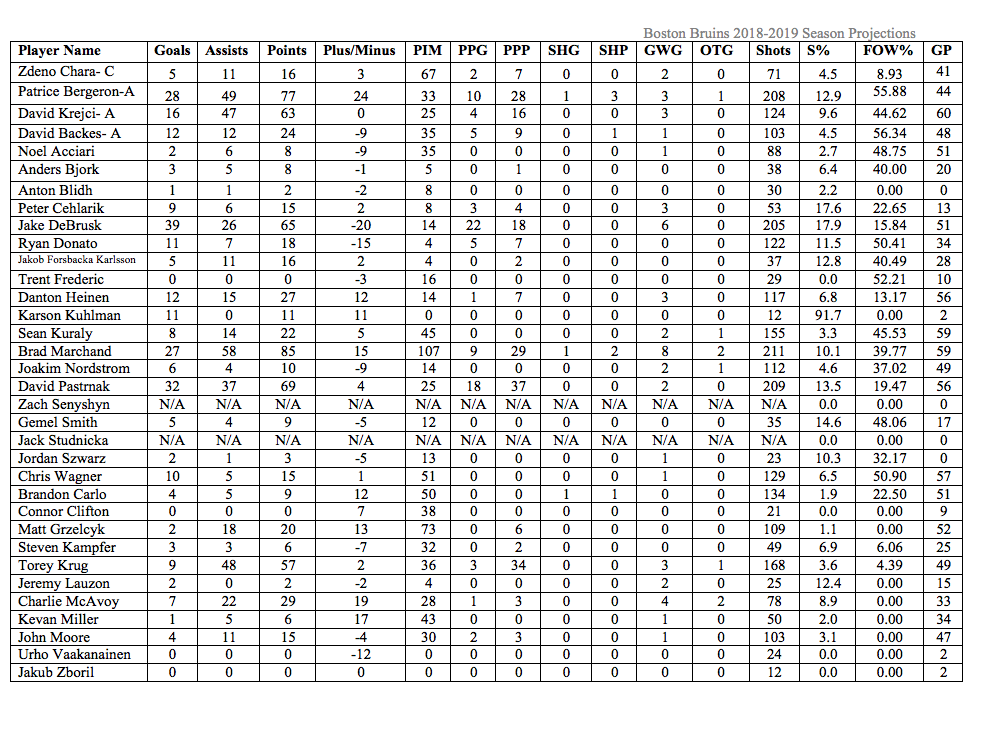
    Coming off a 3-2 shootout loss to the Boston Bruins on Wednesday, the Vegas Golden Knights (32-25-5, 69 points, 3rd in the Pacific Division) have 20 games remaining in the 2018-19 regular season.

    These aren’t your father’s Golden Knights, as production is down from their inaugural season in just their 2nd season of existence.

    Though Marc-Andre Fleury (29-18-5 record, 2.60 goals against average, .908 save percentage in 52 games played) remains Vegas’ starter on an almost nightly basis, backup goaltender, Malcolm Subban (3-6-0, 2.76 GAA, .912 SV% in 10 GP) has struggled to carry his own weight.

    Despite bringing in Paul Stastny via free agency and Max Pacioretty via trade, the Golden Knights haven’t been immune to the injury bug this season.

    Stastny and Pacioretty themselves have joined Reilly Smith and others throughout the lineup on the injured reserve or out of playing action for various points of the season.

    While the Pacific Division title might be out of reach for Vegas this season, a divisional spot in the 2019 Stanley Cup Playoffs is all but assured as long as the floor doesn’t fallout from underneath Gerard Gallant and his players.

    Of note, the Arizona Coyotes are emerging once again with a late season push for the playoffs– and this time around, they’re doing it without their starting goaltender, Antti Raanta (out for the season due to injury).

    Plus the Vancouver Canucks are still in contention and, well, that’s about it, realistically among Pacific Division teams that still have a chance for the last divisional spot and/or a Western Conference wild card berth.

    Anyway, back to the Golden Knights.

    Here’s a look at the latest Vegas forecast– keeping in mind there are many variables that can and will effect the final outcome, such as injuries and/or being called up, assigned, traded, lucky or unlucky.

    This forecast is just an educated guess. It’s a glimpse of what could be or could’ve been by the end of the regular season.

    As always, my degree is in communication– not math– and hockey is naturally steeped in context and holistic unpredictability. Nothing can account for sheer puck luck, the odd bounce or a blown call.

    If a player reaches the expected outcome, they’ve met expectations. If said player exceeds the forecasted stats, they’ve exceeded expectations (naturally). Of course, if a player does not perform, then they did not live up to expectations.

    On a game-to-game basis, whatever’s on the scoresheet can indicate general trends that can be further broken down into an educated forecast.

    At best, it’s a guess. At worst, well, it doesn’t really matter– it’s not like Golden Knights General Manager George McPhee is reading this and making his roster decisions based on what’s here, right?

    If he is, I’d like a job, please. Thanks.

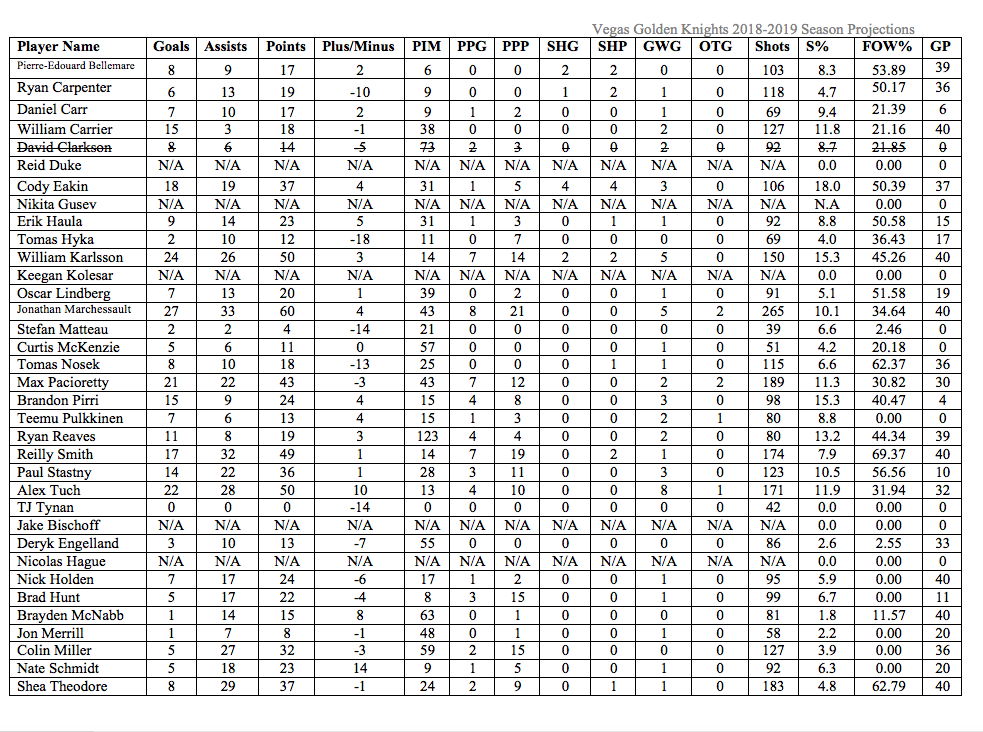
    Vegas Golden Knights Forecast Through 62 Games (20 Games Remaining)
    WordPress, when are you going to make the ”gallery” option again (and actually make it good like how it used to be)?

    Among forwards, Vegas’ consistent first line last season of Jonathan Marchessault, William Karlsson and Smith hasn’t had as much consistent luck and skill this season.

    Though Smith has battled injury this season, Marchessault remains one of the Golden Knights most consistent performers expected to lead his team in goals (25) and points (54) with 25-29–54 expected totals.

    Now what about Karlsson?

    Good question, what about him? Things haven’t gone exactly as planned in terms of capitalizing on his breakout season last season with a new contract in the offseason and higher expectations for this season.

    Karlsson’s bridge, one-year, extension last summer coming off the backs of a 43-goal season has only managed 18 goals thus far– including four goals in the last 22 games for the Golden Knights.

    Given his current trend, Karlsson is expected to amass 21-23–44 totals. He’d be tied with Pacioretty for 2nd place in expected goals (21) and 3rd in expected points (44) on the roster, but nowhere near the emergent star in the making that he was last season.

    While he very well could bounce back– similar to Smith in nature, following a good-year, bad-year, good-year, bad-year pattern– the phrase “what have you done for me yesterday” won’t help him in his next contract negotiation this summer unless McPhee gives him the benefit of the doubt.

    Meanwhile, Alex Tuch is expected to finish the season with a career-high 20-33–53 expected totals.

    That’s comforting to hear for a team that needs to rely on secondary scoring in the midst of a recession in primary production.

    Tuch is expected to lead in assists (33), followed by Smith (30) and Marchessault (29), while Marchessault is destined to lead in points (54) over Tuch (53) and Karlsson (44).

    On defense, Vegas’ blue line will finish off the season being led by Shea Theodore (11-21–32 expected totals), followed by Colin Miller (30 expected points) and Nate Schmidt (25 expected points despite missing the first 20 games of the season while serving a suspension for testing positive for a performance enhancing drug).

    In net, Fleury looks like he’s bound to break under the weight of all the minutes he’s been playing and will play this season. A 2.74 expected GAA and .909 expected SV% is not starting goaltender material, unless we’re talking about Sergei Bobrovsky with the Columbus Blue Jackets or something.

    But it’s not like Gallant can really count on his current backup to offset some of Fleury’s load. Subban’s expected 2.70 GAA and .912 SV% isn’t tremendous either.

    If anything, it’s an indication that McPhee could help bolster his team with the acquisition of an extra goaltender by the trade deadline.

    Someone like Ryan Miller, 38-years-old, could help steal some crucial points for the Golden Knights down the stretch if the San Jose Sharks aren’t already in the process of completing a trade for the goaltender with the Anaheim Ducks.

    Growing pains are a fact of life– especially in sports– and Vegas is going through puberty already in its 2nd season. This season’s been full of highs, lows and awkward phases that hopefully will end in a glow up.

    Otherwise we’ll all be looking back at this season shaking our heads at how it could pull off that much denim or something back in the day.

  • Boston Bruins 2018-19 Forecast Through 60 Games

    The Boston Bruins and the rest of the NHL are nearing the annual trade deadline. Through 60 games played, the Bruins are currently 2nd in the Atlantic Division with a 35-17-8 record (78 points) behind the Tampa Bay Lightning (46-11-4, 96 points).

    Wednesday night, the B’s will play their 61st game of the season when they visit the Vegas Golden Knights (new forecast coming soon for that club too), but before they do that, here’s a quick review and a glimpse of what could be based on this latest forecast with 22 games remaining in the 2018-19 regular season for Boston.

    After getting off to a quick start in October, despite a blowout on Opening Night, the Bruins fell into a bit of a lull in November and December.

    Jaroslav Halak (15-9-4 record, 2.35 goals against average, .923 save percentage in 30 games played) helped carry the weight through November, before regressing towards the end of December into January. As long as the wins rolled in, the team was making progress.

    Tuukka Rask (20-8-4, 2.45 GAA, .918 SV% in 33 GP) has not lost in regulation in his last 15 starts as the B’s carry a six-game winning streak into Vegas for Wednesday night’s matchup.

    Though Halak is expected to start against the Golden Knights, Rask and his counterpart have formed a solid 1A/1B option for the Bruins all season long– considering league scoring is up and the B’s have allowed the 3rd fewest goals against (155) in the league, behind only the New York Islanders (138) and Dallas Stars (154).

    The Bruins went 7-7-0 in December and improved to 6-3-3 in January.

    Yes, I know that’s still a .500 win-percentage, but points percentage wise, that’s 14 out of 28 possible points in December and 15 out of a possible 24 points in January (progress!).

    Yet, by the end of January and through all of February thus far, the B’s have been starting to reach another gear.

    The first line has been consistent all year, while General Manager Don Sweeney is in search of the last missing piece among top-six forwards to complete the second line.

    Meanwhile, Sweeney was working the trade deals on Wednesday, acquiring Charlie Coyle (10-18–28 totals in 60 games played this season, 91-151–242 totals in 479 career games) from the Minnesota Wild in exchange for Ryan Donato (3-6–9 totals in 34 games, 11-7–18 totals in 46 career NHL games) and a conditional 2019 5th round pick.

    If the Bruins advance to the Second Round of the 2019 Stanley Cup Playoffs, then the 5th round pick becomes a 2019 4th round pick (originally belonging to the New York Rangers, previously acquired by the Bruins along with Steven Kampfer in exchange for Adam McQuaid on Sept. 11, 2018).

    Coyle will boost Boston’s third line and can play second line minutes if necessary, but isn’t the end-all, be-all solution for a Cup run.

    Anyway, without further ado, here’s a look at the latest Bruins forecast– keeping in mind there are many variables that can and will change things, like injuries and/or being called up, assigned, traded, lucky or unlucky.

    This forecast is a glimpse at expected outcomes.

    If a player does better, then they exceeded expectations. If said player does worse, then they didn’t meet expectations (for one reason or another).

    My degree is in communication– not math– and hockey is naturally steeped in context and holistic unpredictability. Nothing can account for sheer puck luck, the odd bounce or a blown call.

    Whatever’s on the scoresheet every night can indicate general trends that can be deciphered to make educated guesses.

    Boston Bruins Forecast Through 60 Games Played (20 Games Remaining)
    I really miss the days of making a nice gallery, but WordPress messed around with that feature…

    First, I know what you’re thinking, “but Nick, how come you still have Donato on the roster still and haven’t included Coyle?”

    There’s two parts to my answer: 1) I ran this forecast after the conclusion of Monday night’s, 6-5, overtime win against the San Jose Sharks, so 2) the Coyle-Donato trade was made early in the writing of this post, so Coyle’s forecast will be reflected at a later date.

    Second, I know you’re also looking at Jake DeBrusk’s expected stats saying “uh, there’s only 20 games left, he can’t possibly score 21 more goals and amass 16 more assists for a total of 65 points this season” and you’re right.

    With DeBrusk’s recent scoring stretch over the last 20 games, his latest forecast gives a bit of a look at what could have been if he hadn’t been going through streaks like he has.

    The same can be applied to David Pastrnak’s expected 32-37–69 totals. Prior to getting injured, Pastrnak’s last forecast had him around the 40-goal plateau.

    After his left thumb surgery– in addition to having missed the last few games, as well as his recent decline in goal scoring over the last 20 games– his numbers are more in line with what to expect when he returns, whenever that is.

    At best, Pastrnak misses the “at least” two weeks he was supposed to miss, makes his return and picks up as close to where he left off as possible.

    At worst, he only scores a few more goals this season after returning later than expected (in the best-case scenario), but is back to being his normal self in a postseason run.

    Anyway, Boston’s offense looks like it’ll be led by Brad Marchand with 85 points on the season. Marchand also looks to lead the team in assists with 58 expected apples, topping Patrice Bergeron (49 expected assists), Torey Krug (48) and David Krejci (47).

    In goal scoring, Pastrnak remains supreme with 32 expected goals, leading Bergeron (28 expected goals), Marchand (27) and Krejci (16).

    On defense, Krug (9-48–57 expected totals) dominates the two-way aspect of the game from the blue line, despite missing a chunk of time due to injury earlier in the season.

    Meanwhile, Charlie McAvoy (7-22–29 expected totals) and Matt Grzelcyk (2-18–20 expected totals) continue to be vital assets alongside their captain and anchor, 41-year-old (soon to be 42-years-old on March 18th), Zdeno Chara (5-11–16).

    In goal, Rask is destined to settle in with a 2.37 GAA and a .921 SV%, while Halak backstops the team to a 2.40 GAA, as well as a .921 SV% himself.

    That’s some consistent goaltending in the crease and plenty to smile about if Sweeney can add more offensive prowess in secondary scoring and perhaps add a depth blue line asset for the playoffs.

  • Numbers Game: 2018-19 League Forecast Entering February

    Whether you’re looking for love or looking to win the Stanley Cup, February is an active month.

    Some teams are buying in on false promises that will ultimately end in heartbreak. Others are selling and living the single life.

    In either case, most teams will be suited for a stretch run– ’til death do [them] part (or they miss out on the playoffs altogether or are eliminated in the postseason).

    So let’s see if it’s a match between your team and finishing first in the divisional standings in this new forecast based on how the league standings were through January 31, 2019.

    Before you scroll down to the tinder box that is known as the comment section and go bumbling on how wrong these numbers will be, keep in mind there’s no guarantees with any forecast.

    It’s not always about the exact number of points expected on the season, but rather the general trends indicated or “educated” guesses that are shown.

    The focus might be on the spread or positioning in the standings more than any specifics. Context is key and nothing’s impossible until it’s mathematically impossible.

    Without further ado, it’s time to take a look at the potential dates available for this season.

    Projected Standings After Four Months

    Eastern Conference

    Atlantic Division

    1. p-Tampa Bay Lightning, 130 points (50 GP entering Feb. 1st)
    2. x-Toronto Maple Leafs, 110 points (49 GP)
    3. x-Montreal Canadiens, 104 points (51 GP)
    4. wc1-Buffalo Sabres, 102 points (50 GP)
    5. wc2-Boston Bruins, 97 points (51 GP)
    6. Florida Panthers, 77 points (48 GP)
    7. Detroit Red Wings, 67 points (51 GP)
    8. Ottawa Senators, 66 points (50 GP)

    In the Atlantic Division the Tampa Bay Lightning are flirting with the President’s Trophy and a 130 point season. But can they take home the best looking person in school or will the Calgary Flames have anything to say about it and steal their date? (more on that later)

    The Toronto Maple Leafs are smitten with 2nd place in their division, but searching for the one to take them all the way (to the Cup). Is this the year that it finally happens?

    While the Boston Bruins have been coming up short in sealing the deal (they went 6-3-3 in January, which was a marginal improvement from 7-7-0 in December), the Montreal Canadiens have been eyeing the last divisional spot in the Atlantic.

    If the Buffalo Sabres can get over their recent dry spell, they’re sure to rebound well and land with the first wild card in the Eastern Conference– successfully reaching the postseason for the first time since 2011.

    At the bottom of the division, it’s more of the same– the exact same (standings-wise) from last month.

    Metropolitan Division

    1. y-New York Islanders, 113 points (49 GP)
    2. x-Pittsburgh Penguins, 99 points (50 GP)
    3. x-Columbus Blue Jackets, 98 points (50 GP)
    4. Washington Capitals, 93 points (50 GP)
    5. Carolina Hurricanes, 89 points (50 GP)
    6. New York Rangers, 79 points (50 GP)
    7. Philadelphia Flyers, 73 points (51 GP)
    8. New Jersey Devils, 68 points (50 GP)

    Things are looking up for the New York Islanders as they continue to hookup with some top-notch strategy put forth by head coach, Barry Trotz. Robin Lehner has been stellar and everyone’s buying in on being accountable as a team.

    Sidney Crosby and the Pittsburgh Penguins are in a long-term committed relationship with making the Stanley Cup Playoffs, but will this one bring another ring to it?

    “Don’t go breaking my heart//I wouldn’t if I [actually] tried,” said Sergei Bobrovsky as he let down Columbus Blue Jackets fans with subpar goaltending, despite somehow clinching the last playoff spot in the Metropolitan Division.

    The Stanley Cup looks like it will be in another’s arms given the recent stretch of play from the Washington Capitals as the team goes through a breakup with the postseason for 2019.

    If things get steamy it’s only because the Carolina Hurricanes are storming and desperately making a charge to quench their postseason thirst.

    There’s not much to be said about the bottom three teams in this division either. Even if Carter Hart is stealing hearts in the City of Brotherly Love. Swipe left.

    Western Conference

    Central Division

    1. y-Winnipeg Jets, 116 points (51 GP)
    2. x-Nashville Predators, 96 points (52 GP)
    3. x-Dallas Stars, 86 points (50 GP)
    4. Minnesota Wild, 86 points (50 GP)
    5. Colorado Avalanche, 85 points (50 GP)
    6. St. Louis Blues, 77 points (49 GP)
    7. Chicago Blackhawks, 66 points (51 GP)

    The Winnipeg Jets are soaring on cloud nine with the Central Division title this season as the Nashville Predators have hit some bumps in the road throughout the season.

    It’s a rocky relationship for the Dallas Stars, Minnesota Wild and Colorado Avalanche in terms of playoff berths. The spread between the three teams in the latest forecast indicates it’s still anybody’s game and though the Stars are tagged as being above the cutoff line in this display, they aren’t safe and sound.

    The St. Louis Blues are creeping their way into a playoff spot in reality, but things could very well go back to the way it was before Jordan Binnington came along as the right man to be number one in Blues fans’ hearts.

    Meanwhile, the Chicago Blackhawks might as well consciously uncouple with their expendable assets by the end of the month– if not before.

    Pacific Division

    1. z-Calgary Flames, 123 points (51 GP)
    2. x-Vegas Golden Knights, 108 points (52 GP)
    3. x-San Jose Sharks, 103 points (52 GP)
    4. wc1-Vancouver Canucks, 88 points (51 GP)
    5. wc2-Arizona Coyotes, 87 points (50 GP)
    6. Edmonton Oilers, 79 points (50 GP)
    7. Anaheim Ducks, 74 points (51 GP)
    8. Los Angeles Kings, 65 points (50 GP)

    Things are heating up in Calgary as the Flames have not just been good– they’re really good. Calgary continues to surge into a definite number one seed in not just the Pacific Division, but the Western Conference as a whole.

    What’s more impressive? The Flames are closing in on the Bolts in the President’s Trophy race. A few odd puck bounces going either way could really hamper what everyone thought Tampa’s all season long.

    Meanwhile, the Vegas Golden Knights are feeling lucky as a rematch with the San Jose Sharks is looking more and more like it’s going to happen.

    It’s a wild race for the wild card berths in the Western Conference, which means that the Vancouver Canucks and Arizona Coyotes could end up on either side of the fence, depending on what kind of dance partner they’re interested in acquiring at the trade deadline.

    Is it time to buy, sell or continue to rebuild?

    For the Edmonton Oilers, Anaheim Ducks and Los Angeles Kings, it’s time to rekindle the spark in their lives.

  • Analysis: Time is the biggest gamble in Brassard, Bjugstad swap

    Midday Friday, the Pittsburgh Penguins and Florida Panthers completed a trade that left many scratching their heads.

    Pittsburgh sent Derick Brassard, Riley Sheahan, a 2019 2nd round pick and two 2019 4th round picks (Pittsburgh’s own and Minnesota’s previously acquired in a deal earlier this week with the Dallas Stars) to the Panthers in exchange for Nick Bjugstad and Jared McCann.

    Brassard, 31, was in his first full season with the Penguins and amassed 9-6–15 totals in 40 games played this season prior to the trade.

    He was acquired by Pittsburgh last February from the Vegas Golden Knights after the Golden Knights added Brassard in a separate deal with the Ottawa Senators first– prior to retaining salary on Brassard’s contract and flipping him along with Tobias Lindberg to the Penguins for Ryan Reaves and a 4th round pick originally belonging to the Vancouver Canucks in the 2018 NHL Entry Draft.

    In 14 games with the Penguins in 2017-18, Brassard added three goals and five assists (eight points) on top of his 18-20–38 totals in 58 games with the Senators prior to being trade deadline bait last season.

    He registered one goal and three assist (four points) in 12 Stanley Cup Playoff games with Pittsburgh in the 2018 postseason before the Penguins were eliminated by the eventual Stanley Cup champion Washington Capitals.

    Never mind what he’s done for you yesterday, Brassard carries a cap hit of $3.000 million per season and is a pending unrestricted free agent this July 1st.

    Not only that, but his salary can be retained one more time on his current contract if Florida desires to flip him by February 25th’s trade deadline.

    The Columbus Blue Jackets’ 6th overall pick of the 2006 NHL Draft, Brassard has 443 points (171 goals, 272 assists) in 756 career NHL games with the Blue Jackets, New York Rangers, Senators and Penguins.

    Sheahan, 27, had seven goals and two assists (nine points) in 49 games with Pittsburgh prior to the trade and was previously acquired by the Penguins in a transaction involving the Detroit Red Wings on Oct. 21, 2017 in exchange for Scott Wilson.

    He is a pending-UFA this July and carries a cap hit of $2.100 million.

    Despite failing to record a point with the Red Wings in eight games in the 2017-18 season, leading to his trade to the Penguins, Sheahan amassed his second-best season of 32 points (11 goals, 21 assists) in 81 games with Pittsburgh and Detroit last season.

    He established career-highs in assists (23) and points (36) in 79 games with the Red Wings in 2014-15 and had a career-high 14 goals in 81 games in 2015-16 with Detroit.

    In 414 career NHL games, the 21st overall pick of the 2010 NHL Draft has 139 career points (56 goals, 83 assists).

    In summary, the Panthers added to a list of growing draft picks in 2019 (presently with nine selections, including three picks in the 4th round), while potentially clearing out enough cap space to pursue some of the big names (*ahem* Artemi Panarin and Sergei Bobrovsky) that might hit the free agency market on July 1st.

    While the move looks like a haphazard approach to writing off this season, Panthers fans will have to be patient and wait for the other shoe to drop in General Manager Dale Tallon‘s masterplan.

    Even if that’s been said before.

    Bjugstad, 26, had five goals and seven assists (12 points) in 32 games with the Panthers at the time of the trade and was the last connection Florida had to the 2010 NHL Draft as their 19th overall selection.

    He posted a career-best 49 points (19 goals, 30 assists) in 82 games last season for the Panthers, establishing career-highs in assists and points.

    The most goals he’s ever scored in one season was 24 in 72 games in the 2014-15 season as a 22-year-old. In five career Stanley Cup Playoff games, Bjugstad has two goals and two assists (four points) with one game-winning goal and a plus-six rating.

    Bjugstad has two years left on his current contract with a $4.100 million cap hit and has 87-104–191 totals in 394 career games (all with the Panthers).

    McCann, 22, had eight goals and 10 assists (18 points) in 46 games for Florida prior to the trade and was originally selected 24th overall by the Canucks in the 2014 NHL Draft.

    He posted his career-best numbers last season for the Panthers with nine goals and 19 assists (28 points) in 68 games while earning a plus-11 rating (his first positive plus/minus outcome in four NHL seasons including the current 2018-19 season).

    McCann has two years left on his current contract at $1.250 million per season and can become a restricted free agent at the end of the 2019-20 season. He has 27-44–71 totals in 212 games with Vancouver and Florida in his young career and was previously acquired by the Panthers in exchange for Erik Gudbranson on May 25, 2016.

    Penguins General Manager Jim Rutherford has a knack for finding overlooked talent in an otherwise not as lively market and making them better in his current tenure with Pittsburgh, however, his latest move in snagging Bjugstad and McCann leaves more to be desired.

    While Rutherford brought in younger players with an additional year remaining on their contract, the gamble remains as to whether or not McCann will fully pan out– or if he does, whether or not he’ll price himself out of Pittsburgh with a tight cap situation and no trade or no movement clauses on some of their larger contracts that extend past 2019-20 currently on the books.

    Rutherford coveted McCann and now the next step will be figuring out how he can become part of the long-term solution.

    In addition to his oft-injured history, Bjugstad is a younger replacement for Brassard– one year after Rutherford made the move to get Brassard.

    Winning back-to-back Stanley Cups in 2016 and 2017 should be enough to overlook an otherwise mismanaged acquisition, however, Bjugstad costs more and now carries the added weight of living up to expectations or else further looking like the beginning of Rutherford’s mistakes on the way down from a Cup window.

    One positive takeaway for Penguins fans– who perhaps know this best– is that Rutherford is active. No one can take that away from him in his search for finding the right pieces to build a dynasty.

    As always, though, it is rare for any general manager in any sport to willingly depart an organization on their terms. Usually it’s the buildup of poor roster moves or repeated postseason failures that leads to “being relieved of duties” and kindly shown the door.

    In short, the biggest takeaway for this deal is… …time will tell.

  • Boston Bruins 2018-19 Forecast Through 40 Games

    In keeping with true fashion to cranking out these forecasts this season, once again I am a couple of games behind in terms of timeliness.

    Nonetheless, the last few games don’t matter– they’re not taken into account for this latest forecast, but they are taken into consideration for future performance as a whole over the remaining “42” games at the time these projections were forecasted.

    Halfway through the season, the Boston Bruins find themselves in 3rd place in the Atlantic Division standings. Despite all the injuries, despite the lack of depth scoring and despite all other areas of regression, the B’s are holding their own weight in a competitive division.

    Bruce Cassidy‘s coaching style and compete level is something to be praised as they’ve weathered the storm, but now the question remains– can they take it to the next level?

    General Manager, Don Sweeney, probably could opt for a scoring winger before the team goes down the stretch and into the playoffs, where, last year’s depth scoring dried up thanks, in part, due to a gamble that didn’t pay off in acquiring Rick Nash to help provide a spark on the second line.

    This season’s team is righting the ship, but are they peaking too early? When will they peak if they aren’t starting to peak now?

    Doubt will always enter the mind. True professionals ignore it and achieve.

    Anyway, to avoid getting too much into coaching philosophy or whatever, let’s take a look at the most recent forecast for Boston and remember there are many variables that can and will change things. Being injured, called up, assigned, scratched, traded, lucky or unlucky will incur damage to the expected stats.

    Unpredictable variables happen. Microsoft Excel knows none of that.

    As always, my degree is in communication– not math. This forecast is just an utopian outlook for the Bruins if every player met expectations.

    Should they do better, then they will have exceeded expectations. If they fall short, then they were injured, out of the lineup or whatever– they didn’t meet expectations and next season’s numbers will reflect a new benchmark for meeting expectations.

    The nature of hockey is both contextually analytical and holistically unpredictable– nothing can account for sheer puck luck or the odd puck bounce, but whatever’s on the scoresheet every night can indicate general trends and be utilized for educated guesses.


    Boston Bruins Forecast Through 40 Games (42 Games Remaining)

    (Just click on the image if you’re having trouble seeing it– WordPress changed their layout so there’s no more slideshow options.)

    Boston’s expected leaders in points indicates an 80-point season for David Pastrnak for the second season in-a-row– and not only that, but a career-high in goals and points.

    Pastrnak is forecasted to lead the Bruins with 39 goals and 43 assists (82 points) with linemate Patrice Bergeron (26-41–67 forecasted totals) expected to be second in the club’s scoring.

    Second line center, David Krejci (15-45–60 expected totals) is bound to be third in Bruins scoring this season with Jake DeBrusk emerging from the haze of injury and a slow start to his sophomore season.

    While Pastrnak is destined to lead his club in goals with 39 in the latest forecast, it appears he’ll be the only Bruin to reach the 30-goal plateau this season, as Brad Marchand is currently forecasted to end up with 27 goals this season.

    Marchand has reached 30-goals for the last three consecutive seasons and the 20-goal plateau in seven out of his eight full seasons he’s played since 2010-11.

    Should he reach 20 goals as expected this season, he’ll extend his scoring prowess to eight out of his nine seasons in the NHL.

    Bergeron’s expected to follow suit with his teammates on what is one of the best lines in the league, ranking third in goals by season’s end with 26, despite missing 16 games due to a rib/sternoclavicular injury.

    In assists, Marchand has emerged as much of a playmaker as he is a natural scorer with the current expectation of 47 assists this season, leading his teammates, Krejci (45 expected assists) and Pastrnak (43 expected assists).

    Marchand set a career-high in assists with 51 last season and is on pace to reach at least 40 assists for the third consecutive season.

    Noted playmaker and usual assist leading suspect, Krejci’s 45 assists would be his best since he had 46 assists in 72 games during 2015-16. Of note, Krejci has not missed a game so far this season.

    Fellow Czech native, Pastrnak is the only other player to have appeared in every game so far.

    On defense, Torey Krug remains supreme with 10-40–50 expected totals, despite missing 11 games thus far. Another 50 points this season would be the third consecutive season of reaching the 50-point plateau for Krug.

    He matched his career-high in goals (14) and set a new career-high in assists (45) last season en route to a career-high 59-point year in 76 games played.

    It’s very likely Krug may exceed expectations, so long as he’s healthy.

    Young stallion, Charlie McAvoy is still on pace for breaking the 30-point benchmark this season, despite missing 23 games through this forecast due to a couple of injuries (namely, a concussion and a lower body injury after blocking a shot).

    While McAvoy’s health may be worrisome this season, Matt Grzelcyk has stepped into more minutes with the expectations of a career-year with 3-19–22 forecasted totals.

    John Moore and Zdeno Chara are both expected to reach 15 points with Kevan Miller adding another 12 from the blue line this season.

    In goal, Boston has seen some stellar action from Jaroslav Halak— though recently he has been trending in the other direction, Tuukka Rask has picked up his pace of play back to where it’s expected night-in and night-out.

    Halak is on pace for a 2.42 goals against average, despite his 2.28 GAA in 22 games played as of this forecast. Still, a 2.42 GAA would be equivalent to his 2.43 GAA in 59 GP in 2014-15 with the New York Islanders.

    His workload shouldn’t reach nearly 60 games this season, so there’s still hope he exceeds expectations and keeps his GAA low, while increasing his expected save percentage.

    Currently, Halak is forecasted to finish the 2018-19 regular season with a .920 SV%– his highest since attaining a .920 SV% in 52 games in 2013-14 for the Islanders. He had a .919 SV% in 36 games with New York in 2015-16.

    Whether Halak will regress back to his usual form remains to fully be seen.

    As has been since Halak’s stellar performances early in the season outplayed Tuukka Rask, Cassidy will have to manage both of his goaltender’s time in the crease– keeping each fresh enough to remain hot and rested for a playoff stretch.

    Rask, in the meantime, is currently forecasted to reach a 2.38 GAA, which would be the second consecutive season of a slightly worse goals against average since he had a 2.23 in 65 games played in 2016-17 (he had a 2.36 GAA in 54 GP last season).

    However, a 2.38 GAA is still respectable, considering his 2.63 GAA in 20 appearances through Boston’s first 40 games this season.

    Boston’s usual starting goaltender is on track for a .919 SV%, which would be Rask’s highest since amassing a .922 SV% in 70 games played in 2014-15– a season in which he was drastically overworked.

    Rask’s career-high .931 SV% came in 2009-10, when he had stolen the starting job from Tim Thomas and played in 45 games.

    He’s also had back-to-back seasons at .929 in 23 games in 2011-12 (while serving as Thomas’ backup) and in 36 games in 2012-13 (during the 48-game lockout-shortened season, in which Rask backstopped Boston to their 2013 Stanley Cup Final appearance).

    Anything at or above .920 in terms of save percentage is usually widely praised. A .919 SV% is not that far off and might actually be more reflective of the increased offense league-wide, but that’s something to research on a different day.

    Regardless, two goaltenders around .920 in save percentage and close to a 2.30 goals against average isn’t a bad thing to have. That’s what some might refer to as an effective “1A/1B” scenario.

    Now fight it out in the comments over who is “1A” and who is “1B” in this case.

  • Numbers Game: 2018-19 League Forecast Entering January

    Happy New Year!

    It’s time to figure out whether or not your team has a legitimate chance of winning the Stanley Cup, making the playoffs, being a seller at the trade deadline or a basement dwelling rebuilder in desperate need of anything but what is happening right now.

    Teams have begun to reach the official halfway point in the regular season (41 games played out of an 82-game schedule) as the calendar flips from 2018 to 2019.

    Here’s a glance at the latest forecast based on how the league standings were through December 31, 2018.

    Keeping in mind, there’s no guarantees with any forecast, but rather general trends and “educated” guesses. It’s not always about the exact number of points expected on the season. Sometimes the focus is on the spread or each team’s positioning in the standings.

    There’s always context. Plus, nothing’s impossible until it’s mathematically impossible.

    So let’s take a look around the league and figure out the future– well, rest of this season, at least.

    Projected Standings After Three Months

    Eastern Conference

    Atlantic Division

    1. p-Tampa Bay Lightning, 125 points (40 GP entering Jan. 1st)
    2. x-Toronto Maple Leafs, 111 points (39 GP)
    3. x-Boston Bruins, 98 points (39 GP)
    4. wc2-Montreal Canadiens, 97 points (40 GP)
    5. Buffalo Sabres, 96 points (40 GP)
    6. Florida Panthers, 84 points (38 GP)
    7. Detroit Red Wings, 75 points (41 GP)
    8. Ottawa Senators, 72 points (40 GP)

    The Tampa Bay Lightning are the dominant team in the NHL right now. There’s no other comparison. They’re in a league of their own.

    Though the Toronto Maple Leafs have surged into one of the league’s most prominent teams this season, they’re no match for the Lightning in the regular season standings Atlantic Division race.

    The postseason might be another story– too bad we won’t get to see these teams meet up in the Eastern Conference Final with the current playoff format.

    For the Boston Bruins, a lackluster 7-7-0 month of December has taken a toll on their outlook. Sure, winning five out of their last seven games is a good sign and all, but missed opportunities and blown chances regardless of the injury status of many of their players this season has brought them back to Earth this season.

    Regression in hockey, however, is to be expected– even for teams that outperformed expectations. Last season was just that– exceeded expectations in the regular season for Boston.

    How will Bruce Cassidy jumpstart scoring depth throughout his lineup if General Manager Don Sweeney doesn’t do anything to add? Time will tell.

    But they’re running out of time as long as Claude Julien and Phil Housley are in consideration for some Jack Adams Award nominations.

    Though the Buffalo Sabres have slumped a bit in the last month, the Montreal Canadiens have solidified themselves as a potential spoiler in the 2019 Stanley Cup Playoffs.

    If it’s not them, it’s definitely Buffalo for sure.

    The race for the Eastern Conference wild card spots should come down to three teams– Buffalo, Montreal and the New York Islanders (unless the Islanders snag a divisional spot in the Metropolitan Divsion– more on that later).

    Look, as good as some players on the Florida Panthers are, it’s not happening this year.

    And for all the hype regarding the Detroit Red Wings early in the season? Yeah, it’s the same as last year. They’re not doing so hot either.

    There’s some good news if you’re an Ottawa Senators fan– wait, they traded their 2019 1st round pick in the draft to the Colorado Avalanche as part of the three-team Matt Duchene trade and didn’t protect it (because they chose to protect 2018’s 1st round pick and offer up 2019’s instead)? Oh. Never mind.

    Metropolitan Division

    1. y-Washington Capitals, 109 points (38 GP)
    2. x-Pittsburgh Penguins, 103 points (39 GP)
    3. x-Columbus Blue Jackets, 102 points (39 GP)
    4. wc1-New York Islanders, 98 points (38 GP)
    5. New York Rangers, 90 points (38 GP)
    6. Carolina Hurricanes, 80 points (38 GP)
    7. New Jersey Devils, 80 points (38 GP)
    8. Philadelphia Flyers, 78 points (38 GP)

    As we get closer to “the stretch” things are heating up in the Metropolitan Division, which might not be as full of garbage as once thought earlier in the year.

    For now, the Washington Capitals appear to be in a serious “defend the castle” mood. They’re the defending champions and they’re pretty hard to beat.

    But the Pittsburgh Penguins are surging. The Pens are on a seven-game winning streak and they’re outscoring their opponents, 28-9, during that span.

    What’s necessary to take into account in the divisional spots in the Metropolitan Division is not that the Capitals should lead the way, but rather, that Washington only has a six-point lead in the current forecast over the Penguins– and seven points over the Columbus Blue Jackets (who somehow find themselves in the “top dog” conversation?)– therefore, anything is up for grabs.

    If the Islanders don’t scratch and claw their way into a divisional spot, they’ll be a wild card team.

    It’s not a completely lost season for the New York Rangers, but it’s not one that’ll end with a playoff berth either.

    The same could almost be said for the Carolina Hurricanes and New Jersey Devils, except one’s a little more inconsistent (and worse off), while the other’s just worse.

    Sure, the Devils are nowhere to be found this season, but Mackenzie Blackwood could change that outlook next year.

    And if Carter Hart‘s ready to take on the full-time role of starting netminder for the Philadelphia Flyers that probably wouldn’t do much for them this season, but it’s promising moving forward.

    This year’s Flyers team just goes to show that the problem’s beyond a GM and coaching change, so don’t be surprised to see some roster turnover.

    Western Conference

    Central Division

    1. z-Winnipeg Jets, 107 points (39 GP)
    2. x-Nashville Predators, 96 points (40 GP)
    3. x-Colorado Avalanche, 91 points (40 GP)
    4. wc2-Dallas Stars, 89 points (40 GP)
    5. Minnesota Wild, 87 points (38 GP)
    6. St. Louis Blues, 81 points (37 GP)
    7. Chicago Blackhawks, 77 points (41 GP)

    The Winnipeg Jets are one of two teams in serious contention for the Western Conference regular season title– and the Nashville Predators won’t even get to raise a banner next season for it.

    Nashville’s been on shaky ground for the last month and, as a result, it shows in the latest forecast. Inadequacy ruptures standards or expectations.

    Anyway, between Winnipeg and the Calgary Flames one of those teams will be the best in the West at the end of the regular season.

    It says something as a whole about the Central Division when the Colorado Avalanche are currently forecasted to slip into a divisional spot in the postseason with 91 points in the standings.

    Usually about 95 points puts you within the wild card range and anything 98 or above brings you into serious contention for a divisional berth.

    What all of this means is there’s a lot of uncertainty from the Avs, Dallas Stars and Minnesota Wild in terms of where they end up, ultimately.

    All three teams have been all over the place– at times– this season.

    Fear not, though, they’re nothing like the St. Louis Blues and Chicago Blackhawks. Nothing makes sense in St. Louis, short of obvious locker room problems and a lack of leadership.

    Whereas, in Chicago, the game plan was already reset to “longterm” last season by default (having finished last in the division). Jeremy Colliton‘s job security is safe for now.

    There weren’t high expectations coming into the season for the Blackhawks and there weren’t immediate expectations for Colliton in their transition from Joel Quenneville to their 33-year-old head coach.

    Essentially, firing Quenneville when they did was an easy way out of having to make things more awkward(?) with a rebuild, but it kind of was anyway given when they did it.

    At least they’re not their rivals in St. Louis– let alone the Los Angeles Kings– where expectations were high after reaping some rewards in the offseason.

    Pacific Division

    1. y-Calgary Flames, 103 points (40 GP)
    2. x-Vegas Golden Knights, 100 points (42 GP)
    3. x-San Jose Sharks, 98 points (41 GP)
    4. wc1-Anaheim Ducks, 92 points (41 GP)
    5. Vancouver Canucks, 83 points (42 GP)
    6. Edmonton Oilers, 82 points (39 GP)
    7. Arizona Coyotes, 76 points (39 GP)
    8. Los Angeles Kings, 75 points (40 GP)

    The Flames are red hot. Can they make 2019 more like 1989 and less like 2004? Does having a goaltender even matter any more?

    Luck’s starting to turn in Vegas as the Golden Knights have come alive and look to make a serious claim at potentially knocking Calgary off from the Pacific Division lead– if they can catch them first.

    Despite their ups and downs, the San Jose Sharks are still a divisional playoff berth kind of team. Expect them to be out of the playoffs before the Western Conference Final though. Surely Martin Jones‘ below average season has to catch up to him at some point, regardless of scoring power.

    With no real competition below them, the Anaheim Ducks are a wild card team that will likely continue to live in the First Round elimination hell until John Gibson single handedly plays every position for the club.

    The Vancouver Canucks have Elias Pettersson and look ready to bring up Thatcher Demko for a full-time role in net, so it’s kind of on, but a little late. Next season!

    Everyone said Ken Hitchcock would turn around the Edmonton Oilers and was dancing in the streets when his first half-dozen games brought the Oilers back into being relevant.

    Well, everyone, except me. Hitchcock’s shtick isn’t fit for the contemporary NHL anymore and his last (and only) Cup win came 20 years ago.

    Sure he might impart some lessons on leadership, but as long as Peter Chiarelli is trading away Drake Caggiula for Brandon Manning and ensuring guys like Milan Lucic are part of the longterm vision…

    The Arizona Coyotes haven’t panned out and it’s not the numbers that have been lying to them. Dylan Strome, their 3rd overall pick in 2015, didn’t develop as planned– whether through the fault of the Coyotes or not– and they traded him.

    That draft was four years ago and Mitch Marner was selected after Strome by the Maple Leafs. Hindsight is 20/20, but still.

    If it’s any consolation, Mikko Rantanen was selected by Colorado, 10th overall, so Carolina, New Jersey, Philly, Columbus and San Jose all missed out on one of the current leaders in scoring.

    Scouting’s not Arizona’s strong-suit from year-to-year, or rather, asset management as a whole it’s just… …not there.

    Finally, Los Angeles, the Grim Reaper’s at the door. Bring out your dead (Cup hopes and dreams for 2019). It’s time to rebuild.

  • Vegas Golden Knights Forecast Through 40 Games

    It’s not the most recent forecast, since the Vegas Golden Knights played Game 41 of their 2018-19 regular season on Saturday against the Los Angeles Kings.

    Nevertheless, it’s time to take a quick check of the pulse of the Golden Knights– how their season has progressed so far and where it appears to be going from here.

    Thanks to some extenuating circumstances, perhaps Vegas fans will forgive me for not being able to get around to their quick forecasted glance after 20 games played this season.

    Why? Because it would’ve been pretty dismal and you don’t need that kind of negativity in your life.

    Although, now at the halfway mark (officially after the game against the Kings, technically unofficially as of this forecast), things have improved, but with a few concerns remaining.

    Nate Schmidt served his 20 game suspension for a performance enhancing drug and for the most part, Vegas’ blue line got the job done.

    The team’s record wasn’t desirable, but guys like Shea Theodore and Colin Miller continued to rise past expectations in their ability– even more so now that Schmidt is back and solidified the defensive zone for the Golden Knights.

    One thing that has plagued the team all season is subpar goaltending.

    Marc-Andre Fleury isn’t getting any younger and Malcolm Subban regressed quite a bit from his debut season as a backup netminder at the NHL level last season.

    Managing playing time in the crease is something to keep in mind and we’ll take a closer look in a minute.

    For now, Vegas stands in a divisional spot in the playoffs in the Pacific. Not nearly as dominant as last season, but keeping up with the legitimate(?) playoff contenders in an otherwise weaker division compared to the rest of the league.

    Without further ado, here’s a look at the remaining 42 games (now 41) on the season and what to expect from the latest forecast.

    Keep in mind, there are many variables that can and will change what goes down from now through the end of the regular season in April, like trades, injuries, general lineup changes, roster moves and anything else unbeknownst to the Microsoft Excel spreadsheet that generates this forecast.

    My degree is in communication– not math. It’s “not my fault”.

    If a player meets the forecasted stats, then they’ve met expectations. If they exceed their forecasted stats, then they’ve exceed expectations.

    And of course, if a player does not live up to the latest forecast, then something went awry (the player could’ve been injured, been unlucky or regressed– a.k.a. didn’t meet expectations).

    Puck luck cannot be predicted, but general trends and estimated gut feelings can indicate a sense of what’s to come based on the results of each and every scoresheet night-in and night-out.

    Vegas Golden Knights Forecast Through 40 Games (42 Games Remaining)

    (Just click on the image if you’re having trouble seeing it– WordPress changed their layout so there’s no more slideshow options.)

    Every set of blessings comes with a set of curses and this year, that rings truer more than ever before for the Golden Knights. Of course, it’s only their second season in franchise history, but it’s still true.

    William Karlsson (24-26–50 expected totals) is having a “down” year compared to last season’s breakout career-year of 43 goals and 35 assists (78 points). Reaching the 50-point plateau is still respectable, but doesn’t scream any guarantees of being on the first line should the postseason roll around.

    Head coach, Gerard Gallant, has enough top-six forward depth to play around with if Karlsson starts to head south, considering Alex Tuch‘s expected 22-28–50 totals, Paul Stastny‘s expected 14-22–36 totals and Max Pacioretty‘s expected 21-22–43 totals.

    Despite the ever-consistent qualities of Jonathan Marchessault (27-33–60 expected totals) and Reilly Smith (17-32–49 expected totals), this year’s Golden Knights team point spread is more spread out.

    As it is, while Marchessault should lead in goals (27), assists (30) and points (60) and Karlsson should be second in goals (24) and points (50), one would think Smith would be second or third in whatever stats Marchessault and Karlsson aren’t leading in.

    However, Tuch’s expected point outcome (50) is tied with Karlsson for the second-most points behind Marchessault and Tuch is expected to rank third on Vegas’ roster in goals behind Marchessault and Karlsson with Smith a distant 5th behind Pacioretty’s 21 expected goals this season.

    While the offense isn’t as impactful from the forwards, the blue line has really come into its own in Vegas.

    Shea Theodore’s expected 8-29–37 totals will be the best of his teammates and fellow defenders in a Golden Knights uniform, leading Colin Miller (5-27–32 expected totals) and Nick Holden (7-17–24 expected totals).

    Nick Holden. That’s right. Holden is ahead of Nate Schmidt (5-18–23 expected totals) in the latest forecast.

    But that speaks to Holden’s resiliency in his career and the chemistry Gallant has found in his pairing every night– coupled, of course, with the fact that Holden is seeing more time on the ice (in the literal “games played” sense) than he has the last couple of seasons with the New York Rangers and Boston Bruins.

    He is a durable top-four defender that’s still in his athletic prime and it is exactly that kind of depth that can take teams deep into a Stanley Cup Final run.

    In goal, Marc-Andre Fleury should land around a 2.61 goals against average and .911 save percentage in a season in which he has been overworked thus far.

    He will continue to be overworked unless Malcolm Subban regains his footing, Gallant argues for calling someone up from the Chicago Wolves (AHL) or Golden Knights General Manager George McPhee makes an acquisition for a suitable backup option if all else fails.

    Fleury has played in 35 of the 40 games up to this forecast. He’s since played in 35 out of the 41 games played by the club this season.

    Subban has played in six games and is 0-5-0 in that span. His expected outcomes are a 2.76 GAA and .907 SV%– both below average goaltending the backup role.

    Whereas if Vegas wanted to try Oscar Dansk or Maxime Lagace without the pressures of coming into the dressing room in an emergency recall situation– unlike last season– a little healthy competition for the backup role might nudge Subban in the right direction and take off some of Fleury’s workload.

    It’s not that Fleury can’t handle 50-plus games anymore as a starting goaltender, but rather, it’s just that he shouldn’t be relied on for about 85% of the games in the regular season as is his current going rate.

  • Numbers Game: 2018-19 League Forecast Entering December

    We’re just over a week into December, I know, but let’s all hop in the time machine and take a retroactive look at how the rest of the season should pan out based on how the league standings were through November 30, 2018.

    Things have started to cool in places around the league (like Carolina), while other clubs (like Buffalo) have heated up to become serious playoff contenders– so let’s take a look at how everything should shake out between now and the first couple of weeks of April.

    There’s no guarantees with any forecast, but general indications start to get a little clearer once the season’s hit the quarter-mark and American Thanksgiving has come and gone.

    Realistically, if your team is anywhere between 1st and 5th in your division, you’re in for the ride of your life still from now through the end of the regular season. If you’re 6th, 7th or 8th, well, it’s never too early to start thinking about the Draft lottery (plus the 2019 IIHF World Junior Championship’s coming up at the end of the month, so that’s exciting too) or about how many games it would take to go on an incredibly hot streak and jump back into the playoff picture.

    Nothing’s impossible.

    Without further ado, it’s time to glance around the league and breakdown some of the unforeseen circumstances that are yet to come.

    Projected Standings After Two Months

    Eastern Conference

    Atlantic Division

    1. y-Tampa Bay Lightning, 108 points (26 GP so far)
    2. x-Boston Bruins, 104 points (25 GP so far)
    3. x-Toronto Maple Leafs, 101 points (26 GP so far)
    4. wc1-Buffalo Sabres, 91 points (27 GP so far)
    5. Montreal Canadiens, 91 points (25 GP so far)
    6. Detroit Red Wings, 85 points (25 GP so far)
    7. Florida Panthers, 84 points (24 GP so far)
    8. Ottawa Senators, 83 points (26 GP so far)

    The Tampa Bay Lightning rightfully lay claim to the crown as the leader of the Atlantic Division at regular season’s end. It doesn’t matter that Steven Stamkos has yet to record a point in six career Game 7s. The Lightning have Nikita Kucherov, Tyler Johnson and Brayden Point on a line of their own. They don’t even need Stamkos.

    Just kidding, they still do, because that other No. 91 signed with the Toronto Maple Leafs in the offseason and just think how explosive a playoff matchup of Tampa and Toronto could be in the Battle of John Tavares Signed Where Leafs Fans Wanted Steven Stamkos To Sign Just A Couple Of Offseasons Ago, But Didn’t Because He Stayed With The Lightning.

    You know it’s going to happen.

    Actually, in the latest forecast entering December, the Boston Bruins slide out of the top spot, because injuries continue to plague their season. However, if they can recover to full health, there’s a good chance they might usurp the Maple Leafs and finish 2nd in the division, unlike what current standings dictate.

    But regaining full health is a major stipulation and part of the reason why– while Toronto is 3rd in this forecast– there’s a good chance the Bruins might (probably will) slip further as January’s forecast nears.

    This is about the time where it’s important to note the overarching focus on this forecast should be on where each team is positioned and how close in points they are to those above and below before placing any concrete emphasis on how things play out from now through the first week of April 2019.

    The Buffalo Sabres make the biggest gain in the Atlantic Division, jumping up four spots in the division standings from the basement to 4th place and a playoff berth (albeit a wild card spot).

    The Sabres 10-game winning streak– combined with the additions of Rasmus Dahlin and Jeff Skinner in the offseason– proved to be a season-defining stretch of games as Buffalo returns to Stanley Cup Playoff action for the first time since 2011 (despite the current 0-3-2 run in their last five games).

    On the outside looking in, the Montreal Canadiens slipped a spot and might be a pretender– especially if Carey Price (11-8-4 record, 2.92 goals against average, .902 save percentage in 23 games played) continues to struggle. To his credit, his GAA is under three now, so there’s that.

    The Detroit Red Wings gained some traction with the ongoing lack of focus in Ottawa Senators video reviews and the Florida Panthers injuries.

    Metropolitan Division

    1. p-Washington Capitals, 108 points (25 GP so far)
    2. x-Columbus Blue Jackets, 99 points (25 GP so far)
    3. x-Pittsburgh Penguins, 98 points (24 GP so far)
    4. wc2-New York Rangers, 92 points (26 GP so far)
    5. New York Islanders, 90 points (24 GP so far)
    6. Carolina Hurricanes, 87 points (25 GP so far)
    7. Philadelphia Flyers, 86 points (24 GP so far)
    8. New Jersey Devils, 81 points (24 GP so far)

    The Washington Capitals remain in control of the Metropolitan Division with the Columbus Blue Jackets and Pittsburgh Penguins in tow.

    Of course, Columbus and Pittsburgh are worth keeping a close eye on as the Blue Jackets have been all over the place near the top and the Penguins have yet to be in playoff position since– actually, pretty much never so far this season.

    Plus there’s the whole “second-half of the season surge” we’re still waiting to see from Mike Sullivan’s bunch. That’ll almost assure Pittsburgh of a playoff berth, if not in a divisional spot, at least.

    The New York Rangers gained two spots since entering November, which means the rebuild’s over!

    Just kidding.

    Look how close the Rangers, New York Islanders and Carolina Hurricanes are forecasted to be in points. Even the Philadelphia Flyers have a chance– mathematically speaking, of course.

    The battle for the last wild card spot in the Eastern Conference is going to come down to one of the teams in the Big Apple and Carolina, especially since the rest of the division lacks clarity.

    Meanwhile, the New Jersey Devils are in the dumps. Taylor Hall isn’t a flash in the pan, but the rest of the Devils are, it appears.

    Western Conference

    Central Division

    1. z-Nashville Predators, 104 points (26 GP so far)
    2. x-Minnesota Wild, 98 points (25 GP so far)
    3. x-Winnipeg Jets, 97 points (24 GP so far)
    4. wc1-Colorado Avalanche, 93 points (26 GP so far)
    5. wc2-Dallas Stars, 90 points (26 GP so far)
    6. St. Louis Blues, 88 points (24 GP so far)
    7. Chicago Blackhawks, 87 points (26 GP so far)

    Both the Nashville Predators and Minnesota Wild remain in the 1-2 spots in the latest forecast. Despite the current hot streak from the Calgary Flames, the Predators are going to be the best team in the conference by the end of the regular season.

    The Winnipeg Jets are starting to become like the Penguins under Sullivan’s reign in that Paul Maurice is bound to lead his team to a second-half of the season surge into a divisional spot (or higher).

    Of course, there’s always a wild card– both in the literal wild card berth and dark horse standpoint– and that’s the Colorado Avalanche.

    The Avs have a great chance at jumping up into a divisional spot, since they’ve gained three positions from the previous forecast entering November to the current forecast entering December. The fact of the matter is the Avalanche are a playoff contender– like last season– but with the added improvement of having built on last season’s experience.

    Then there’s the Dallas Stars, who might find themselves landing in a wild card position by circumstance (have you even seen the Pacific Division?) and by luck in Jim Montgomery’s first season behind the bench.

    Towards the cellar of the Central Division, the St. Louis Blues are bad, but not as bad as they are currently, which isn’t great news if you’re trying to lose for Jack Hughes.

    But if you’re a Blues fan who hates rivals more than losing, there’s a positive takeaway– the Chicago Blackhawks are destined to finished last in the Central. They’re bad. Very bad.

    Pacific Division

    1. y-San Jose Sharks, 97 points (26 GP so far)
    2. x-Anaheim Ducks, 97 points (28 GP so far)
    3. x-Calgary Flames, 93 points (26 GP so far)
    4. Vegas Golden Knights, 85 points (27 GP so far)
    5. Edmonton Oilers, 82 points (25 GP so far)
    6. Los Angeles Kings, 79 points (26 GP so far)
    7. Arizona Coyotes, 78 points (24 GP so far)
    8. Vancouver Canucks, 78 points (28 GP so far)

    The San Jose Sharks’ grasp on the Pacific Division is loosening as the Anaheim Ducks are heating up as one of the hottest teams out west– and that’s not including the one with fire in their name.

    San Jose should– should— hit their stride at some point and have everything click into place, but if they don’t the Ducks are hot on their tail. How close? Close enough to show there’s no difference in their forecast total points in the standings by the end of the regular season.

    The Sharks could be first or they could be second. Perhaps the Calgary Flames have something to say about that.

    It’s anybody’s game in the Pacific Division playoff berths, but one thing’s for sure, there’s not going to be a wild card team coming out of the Pacific.

    For the Vegas Golden Knights, that means they’re really going to have to soar and never let their foot off the gas. Vegas only survived so much without Nate Schmidt in the lineup on their blue line– they can’t afford any more major bumps in the road.

    The Edmonton Oilers have Ken Hitchcock behind the bench and while they might appear to be gaining ground, they’re sure to be just outside of the playoff window looking in like how Hitchcock’s Stars were last season. Just wait for the implosion.

    In the bottom three, the Los Angeles Kings might not be as terrible as they have been if 1) Marco Sturm gets named head coach and Willie Desjardins’ interim basis comes to a close and 2) the Kings light a fire under their grizzled veterans and revive whatever’s left of them this season.

    The Arizona Coyotes are on par with how Arizona’s been the last few seasons. Not great, but not terrible and sometimes downtrodden due to injury.

    The hype surrounding the Vancouver Canucks in October and early November was just that– hype. No amount of Elias Pettersson, Bo Horvat and Brock Boeser can compensate for the holes on the blue line and lack of goaltending. It’s almost as if Canucks General Manager Jim Benning has been living a Groundhog Day career from year-to-year with Vancouver.

    Their offense is good, their defense is suspect and their goaltending isn’t starter quality.

  • Columbus Blue Jackets Forecast Through 24 Games

    It’s past the quarter mark of the 2018-19 regular season for the Columbus Blue Jackets, but thanks to the way the calendar (and life) works out, I’m a few games behind on presenting my latest forecast for Columbus.

    Thankfully, the Blue Jackets have a couple of days between their game on Monday (a 7-5 victory against Detroit) and their next matchup against Minnesota on Thursday.

    As such, here’s a quick look at what to expect through the remaining 58 games this season.

    Keep in mind, there’s many unknown variables that will change what’s to come due to injury, lineup changes, roster moves and whatever else Microsoft Excel doesn’t already know. My degree is in communication– not math– and I’d like to keep things as brief as I can in John Tortorella fashion so you can look things over, get a gist of it and go back to watching the game.

    If a player meets the forecasted stats I’ve updated, they’ve met the latest expectations. If they do better, they’ve exceeded expectations. Of course, if they do worse– they just didn’t live up to expectations– it’s that simple. Well, either that or they missed a lot of action due to injury or something.

    Anyway, you can’t forecast puck luck, but you can indicate general trends and estimated hunches based on what the scoresheet indicates each night.

    download

    Columbus Blue Jackets Forecast Through 24 Games (58 Games Remaining)

    This slideshow requires JavaScript.

    Good news, Blue Jackets fans, Artemi Panarin should reach the 80-point plateau this season. Bad news, Blue Jackets fans, Panarin’s still a pending-unrestricted free agent at season’s end and still doesn’t seem intent on sticking around in Columbus.

    Other than that, Cam Atkinson is expected to amass 62 points this season (35 expected goals, 27 expected assists) and lead the team in goals, while Pierre-Luc Dubois sits one goal shy of reaching 30 this season.

    Josh Anderson should tie Panarin for third place on the roster in goals scored this season with 26 expected goals, while Nick Foligno and Boone Jenner contribute close to 20 goals each.

    Newcomer Anthony Ducliar continues his career revival with respectable 19-18–37 expected totals and Zach Werenski should lead all defenders in expected goals (14), assists (32) and points (46).

    Meanwhile, noted top-pairing blue liner Seth Jones, should amass 10-28–38 totals from the point with Werenski beating out Jones in goals from the blue line by four.

    Scott Harrinton’s expected 18 points fit perfectly behind Ryan Murray (30),  Markus Nutivaara (25) and David Savard (24) as the Blue Jackets defensive corps continues to improve at moving the puck out of their own zone and into quality scoring opportunities.

    Other than Panarin’s uncertain future, the only other concern for Columbus revolves around the franchise’s stability in net.

    Sergei Bobrovsky‘s expected goals against average has worsened after the first quarter of the season. It’s now set to be a 2.46 GAA by season’s end. Yeah, that’s not great.

    In fact, it would be Bobrovsky’s worst GAA since he posted a 2.75 in 37 games played in 2015-16. To begin with, he’s at a 2.74 currently with a .912 save percentage in 16 games this season.

    At least Bobrovsky’s save percentage is expected to improve to a .920 SV% by the time 2018-19 wraps up.

    Backup netminder, Joonas Korpisalo should end up with a 2.61 GAA and .919 SV% by season’s end, which would be significant improvements from last season’s 3.32 GAA and .897 SV% in 18 games.

    As is it, Korpisalo has a 3.73 GAA and .886 SV% through nine games played this season, so things can only get… better? That’s the hope anyway.

    Columbus has to work on suppressing shot attempts against, let alone shots on goal, since they’re evidently overworking their goaltenders and it’s showing (remember, a goalie has to move around and “make the save” regardless of whether or not the puck actually hits the net as an official shot on goal).

    It’s either that or maybe Bobrovsky isn’t worth as much as some might think he is (because he’s also a pending-UFA in July)– especially in a contract year.

    Somehow the Blue Jackets find themselves 2nd in the Metropolitan Division with 30 points on the season and a 14-8-2 record on the season and a plus-six goal differential.

    So has Columbus been under the radar and quietly good? Or are they just quietly lucky and surviving in a volatile division (whereby the Pittsburgh Penguins– remember them? they won back-to-back Cups in 2016 and 2017– are currently 6th in the division outside the playoff picture)?

    Time will tell or @capncornelius and/or @vanekatthedisco might fill you in on their outlook sometime.

  • Carolina Hurricanes 2018-19 Forecast Through 20 Games

    Before the action gets going Wednesday night against the Toronto Maple Leafs, let’s take a quick second to give an updated forecast on the Carolina Hurricanes roster through 20 games played in the regular season.

    Carolina currently sits 5th in the Metropolitan Division with a 9-8-3 record (21 points) on the season and has been all over the board in the league’s most tumultuous division thus far. The Hurricanes have been as high as 1st place in the Metropolitan and as low as 7th in the division on Nov. 6th (then again on Nov. 10th and 11th).

    The Canes stormed out of the gate, then quickly dissipated around Halloween dropping out of the lead– but still maintaining a divisional playoff spot– before the rise of the Columbus Blue Jackets bumped them out of a postseason berth altogether on Nov. 1st.

    They flirted with a wild card spot for a few days before the sinking ship began to carry too much water.

    Head coach, Rod Brind’Amour has implemented a new style in the Hurricanes organization, featuring an emphasis on more shots on goal than ever before regardless of the actual scoring outcome.

    Carolina is infected with the youth bug. Rookie mistakes and inconsistencies are to be made and a rookie coach trying to avoid the inevitable errors is no small task. Nothing is truly overnight and through the first quarter of the regular season, the Hurricanes are finding that out.

    There’s some good news, however, as the Metropolitan Division is separated by a mere eight points from the Blue Jackets (1st) to the Pittsburgh Penguins (8th), so fixing the weak-spots in one’s game should lead to some separation from the competition with enough wins stringed together.

    But with good news, there’s always some bad news too and that is what’s to be expected.

    No really, as in the expected outcomes for the Hurricanes latest forecast– it’s not great.

    Here’s the latest updated forecast for Carolina through the first 20 games of the regular season, keeping in mind there are many variable that will change what’s to come due to injury, lineup changes, etc. unknown to the frontiers of Microsoft Excel’s formulas.

    As always, my degree is in communication– not math.

    If a player meets the forecasted stats, they’ve met expectations. If they do better, they exceed expectations. If they do worse, they either missed a lot of action or didn’t live up to expectations.

    There’s nothing to forecast puck luck, but we can point out trends and general indications from the scoresheet each night.

    download

    Carolina Hurricanes Forecast Through 20 Games (62 Games Remaining)

    This slideshow requires JavaScript.

    If anything, it’s promising that Sebastian Aho is on track for 26 goals and 43 assists (69 points) in his third NHL season. Next to Teuvo Teravainen‘s 17-35–52 expected totals, that’s about as far as it goes for excitement.

    Only Aho, Jordan Staal and Micheal Ferland are expected to reach the 20-goal plateau for the Hurricanes this season. To make matters worse, Staal should end up with 22 goals and Ferland with 20, meaning Carolina will barely even have three players past the 20-goal mark. Yikes.

    Hey at least Victor Rask is back from injury after missing the first 20 games.

    On the blue line, three defenders will reach the 30-point plateau in expected points as Dougie Hamilton (12-26–38 expected totals), Justin Faulk (10-27–37 expected totals) and Jaccob Slavin (6-24–30 expected totals) lead the way in scoring from the point.

    Considering the rest of the offense isn’t necessarily there, at least the defense is pretty respectable, all things considered.

    If the Hurricanes get things going, they can capitalize on overall improvements and likely end up with at least two blue liners pushing 40 points. If they don’t– they might be worse than middle of the road. Again.

    In goal, well, it’s the same old, same old.

    Scott Darling (2.97 expected goals against average and .899 expected save percentage) has yet to prove he is a capable starting netminder. In fact, his expected totals as things stand right now wouldn’t even be backup goaltender caliber.

    Petr Mrazek (2.73 expected GAA, .907 expected SV%) might have something left in the tank for one last chance at redemption and becoming a starter– if his defense can tighten its game up and limit quality shots against.

    As for Curtis McElhinney (2.87 expected GAA, .908 expected SV%), well, he’s a decent backup in a limited role, so if Carolina wants to continue with a three-goaltender rotation, McElhinney is certain to improve his overall forecast, though only to respectable backup numbers.

    After 20 games into the regular season, the Hurricanes aren’t looking much different from last season. This, of course, after they traded their best scorer in Jeff Skinner to the Buffalo Sabres in the offseason for peanuts (draft picks).

    Brind’Amour has improved Carolina’s pace of play, but he can’t do anything about the roster that was dealt to him. That’s where General Manager Don Waddell is going to have to get crafty– and soon, given the perpetual rebuild and playoff drought since 2009.