
Welcome back to another exciting rendition of “let’s trust the guy with a degree in communication to do some basic math stuff”.
As you are hopefully already aware, I kept the 2019-20 forecasts under wraps simply because I didn’t have the time and/or motivation to write up an explanation for each and every one of them.
Even still, I’m “behind” on 2020-21 posts given that the Columbus Blue Jackets have already reached the 20-game mark of the season.
That’s why we’re looking at both what the expectations were coming into the condensed 56-game schedule, as well as how things are holding up after the first, well, almost half the season.
If you’re a fan of numbers and things, you probably already read about this “catch-up format” in my first forecast for the Boston Bruins roster entering 2020-21. If you’re just a Blue Jackets fan, I’ve done my best to paraphrase my own writing, but you can go back and read it if you feel inclined.
As always, keep in mind that my degree is in communication and my minor was in sport management. My Intro to Stats class only fulfilled the math portion of my “general education” and met once-a-week at night for two-and-a-half hours in the fall 2013 semester.
I actually learned how to use the forecast function in Microsoft Excel in one of my sport management classes. Besides that, I got a “C” in that Intro to Stats class, so my credentials for doing this seem promising, right?
First year players are impossible to predict until they’ve had at least one National Hockey League game under their belt.
Young players that have had minimal NHL experience may also reflect “inflated” results– Liam Foudy’s forecasted assists entering the 2020-21 season has been highlighted for this reason.
Entering this season, he had only been part of two career NHL games and had one assist in that span. The forecasting function accounts for a player’s entire career and does some mathematics to come up with something over a predetermined number of games for the upcoming season (in this year’s case, 56).
In other words, Foudy’s forecast after 20 team games played should look a bit more “realistic”, for the lack of a better term.
A forecast is not the same as predicting pace.
Foudy has three assists in 12 games played in 2020-21, for example, and is forecasted to finish with about 11 on the season, whereas he is currently on pace for about eight helpers.

There are numerous variables that can, and will, impact a players’ performance throughout the year, including injuries, being a healthy scratch (or on the taxi squad), other American Hockey League related or waiver related transactions, sickness, COVID protocol, suspensions and general superstitions related to individual routines, beliefs, etc. (getting enough sleep before a game, wearing a certain lucky tie, using the same undershirt or shoulder pads for the last 13 years or whatever).
Players can get “hot” or “cold” at any point.
It’s not something that can be accounted for in a numerical forecast that sets aside the “eye test” until you try to figure out the nuances of how or why a player is playing the way they are playing.
In a perfect timeline, this forecast pretends nothing bad could ever happen and every Blue Jackets player lives up to their expectations. In reality, some will pan out, some will exceed expectations and some will fall short for whatever reason.
It’s an educated guess for an outcome in a sport that’s highly unpredictable due to its collectivistic nature and sheer puck luck.
Columbus Blue Jackets Forecast Through 0 Games (56 Games Remaining)
First up, let’s take a look at how things were expected to go coming into the 2020-21 season.
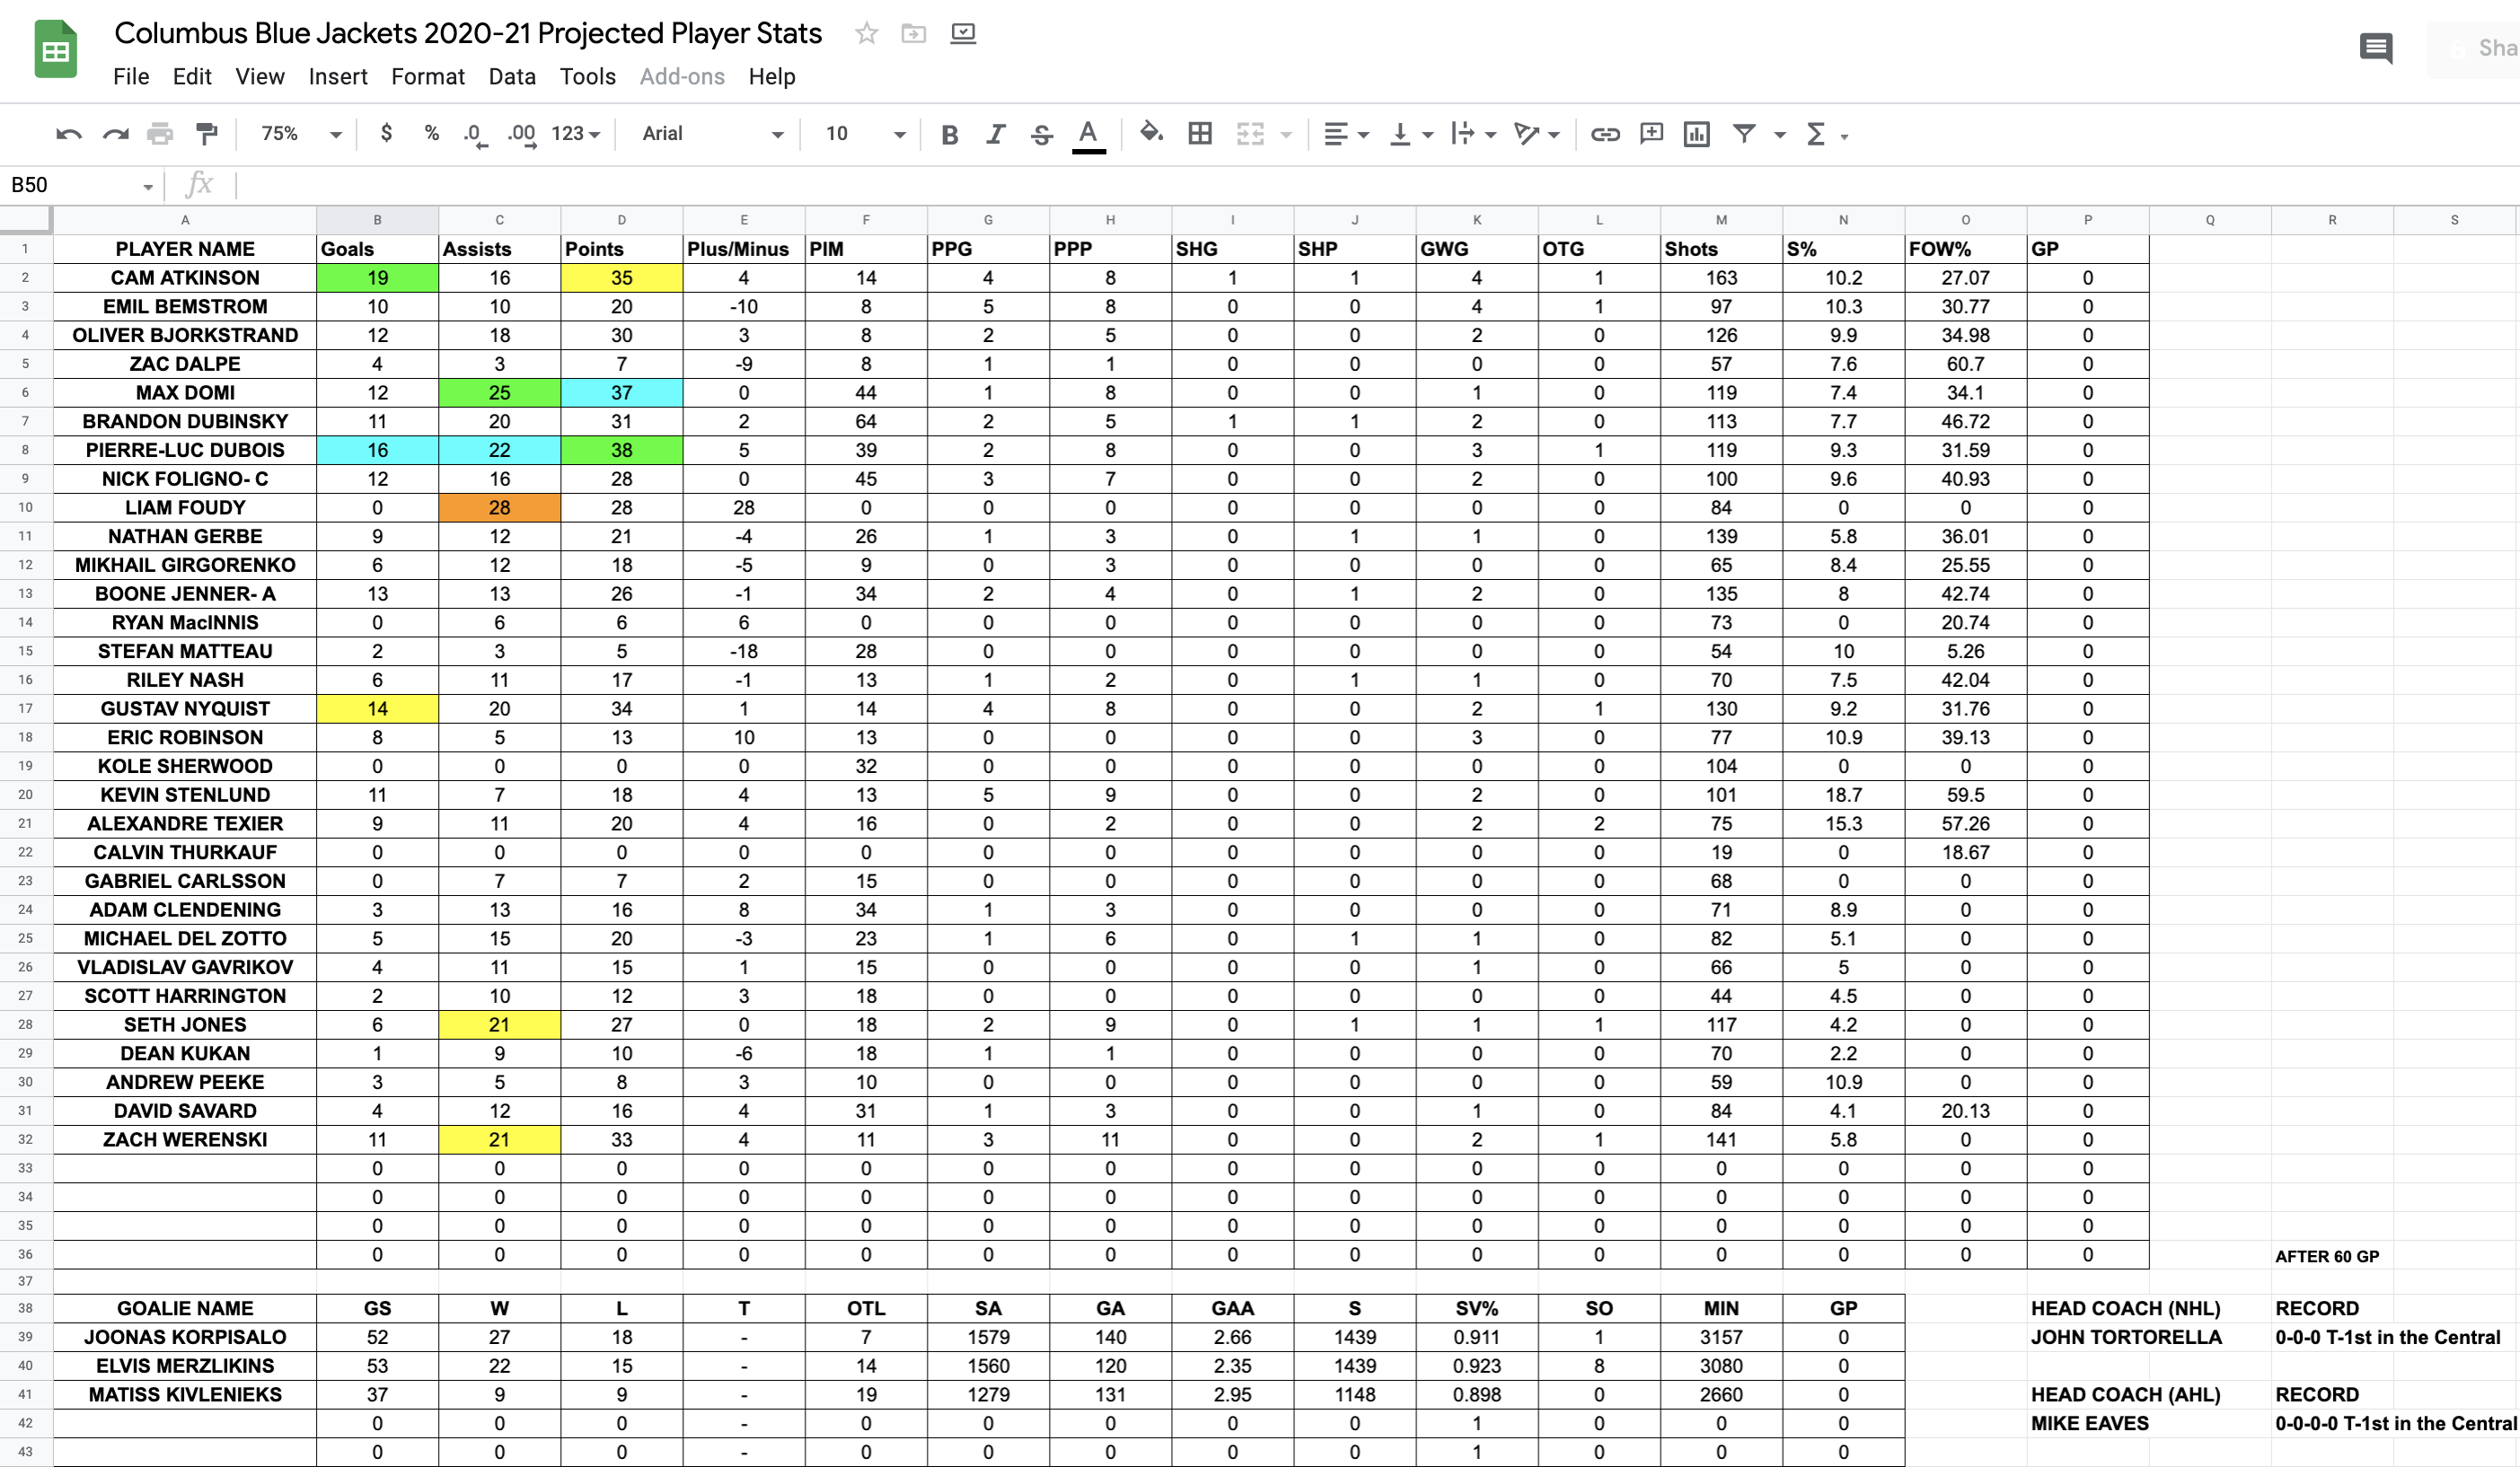
Prior to being traded to the Winnipeg Jets for Patrik Laine and Jack Roslovic, Dubois was forecasted to lead Columbus in scoring with 16-22–38 totals this season.
New acquisition, Max Domi, was forecasted as a close second to Dubois with 37 points– leading the team in assists in the process with 25 (among NHL regulars last season, since Foudy technically was forecasted to lead in assists among Blue Jackets with 28).
Of course, Dubois was traded and Laine and Roslovic are off to hot starts with Columbus– scoring goals in bunches when they find the scoresheet, it seems. We’ll get to that in a minute.
Cam Atkinson was forecasted to score 19 goals prior to the start of the 2020-21 season, which leads Dubois’ 16 forecasted goals and Gustav Nyquist’s 14 forecasted goals on the roster.
Dubois, of course, was traded and Nyquist is out due to injury for most of this season, so… that checks out.
On defense, Zach Werenski and Seth Jones were expected to continue to lead with the way with 33 and 27 points, respectively, from the blue line.
Both defenders are expected to amass 21 assists this season– good enough for the third most forecasted among Blue Jackets skaters entering this season.
In the crease, John Tortorella will have to find the right balance between Joonas Korpisalo and Elvis Merzlikins.
There’s potential for a really solid goaltending duo in Columbus if Korpisalo is the starter and can best his 2.66 forecasted goals against average, as well as his forecasted .911 save percentage, while Merzlikins manages to find a way to reach his 2.35 forecasted GAA and .923 forecasted SV%.
Of course, after 20 team games played, Merzlikins is currently out with an upper body injury, so time will tell if he can return to form.
Columbus Blue Jackets Forecast Through 20 Games (36 Games Remaining)

Through 20 games of the 2020-21 season, the Blue Jackets are three points outside of the last playoff spot in the Discover NHL Central Division, trailing the Chicago Blackhawks for this season’s 4th place cutoff line.
The acquisition of Laine and Roslovic have been quite a welcome sight for Columbus fans, though consistency from the rest of the lineup remains to be an issue.
Laine, however, is currently forecasted to lead the team in goals (26) and points (46), while Roslovic is on track for 10-17–27 totals, which is about what he had in 71 games with the Jets last season (29 points).
Using the current forecasted totals, Roslovic is on track for about .551 points per game this season. He had .408 points per game with Winnipeg in 2019-20.
Atkinson remains in the top-three in scoring, trailing Laine in goals and points with 20 forecasted goals and 39 forecasted points, respectively, while Oliver Bjorkstrand is currently forecasted to amass 15-21–36 totals (the third most on the current roster).
On the blue line, Jones leads the way among defenders in points (32), as well as all skaters in assists with 27 forecasted assists through 20 team games played in the 2020-21 season.
Werenski is more in line with what you’d expect from a young defender of his caliber (8-16–24 forecasted totals) and has missed time due to injury, so that’s clearly a factor in his forecasted drop from before the season began to now.
In the crease, Korpisalo is sure to get more starts than Merzlikins as the latter is currently injured.
Korpisalo’s current forecast yields a goals against average between 2.59-2.63, while Merzlikins is on track for a 2.29-2.33 in however many games he ends up getting.
Why the range in GAA?
That’s new for this season.
It’s just to show a range between what the forecasted total is according to the model and what the adjusted forecast shows (calculated based on the forecasted goals allowed/forecasted minutes multiplied by 60, as one would traditionally do with goals allowed/minutes played multiplied by 60 to determine GAA).
I’m no statistician and I felt like there might be a way to try to get a better read on how things are going for goaltenders (with or without enough necessary data to yield a “realistic” result).
Don’t make any bets using only this forecast. If you’re a professional, you probably already know that.
Anyway, Korpisalo has a forecasted range between .912 and .913 in save percentage through 20 team games played and Merzlikins is on track for between a .923 and a .924 in SV%.
Again, a similar principle applies here.
One end of the range is the straight up forecast, while the other is influenced by forecasted saves/forecasted shots against.
Well, that does it for this forecast. Tune in after 40 team games played to see how things might go down the stretch (the final 16 games this season).

You must be logged in to post a comment.